Telecom Data Analytics
Summary
Worked on telecom network data to identify anomalies and correlation between different KPIs to track the source of anomaly.
The story
Working with Sonalake state-of-the-art time-series analytics methods were used to solve various problems in telecom network management.
- The first one was trend analysis, where the trends in some key KPIs could help plan a telecom network operator figure out where to install additional capacity and how to plan future expansion. We used decomposition methods to better predict trends in various KPIs.
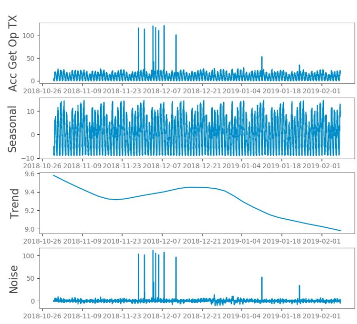
Fig. 1: Decomposition of time series to better predict trends in KPIs - Anomaly detection is another area where telecom networks need some automation, as there are literally hundreds of KPIs which they monitor and manually looking for anomalies is not feasible. Automated ways to detect anomalies can improve quality of service. We used several methods to detect anomalies automatically in each of their KPIs and flag them in a timely manner.
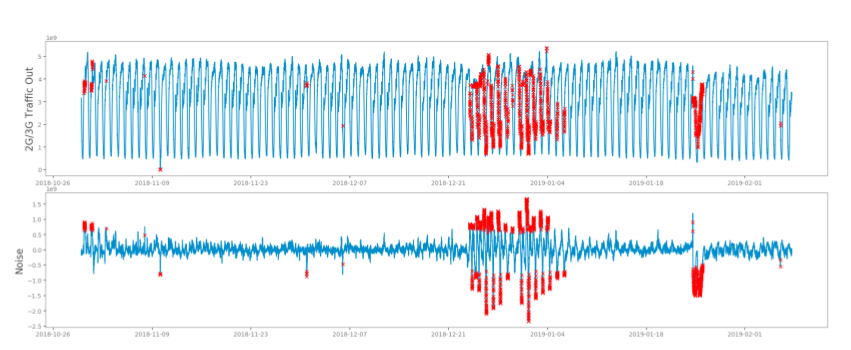
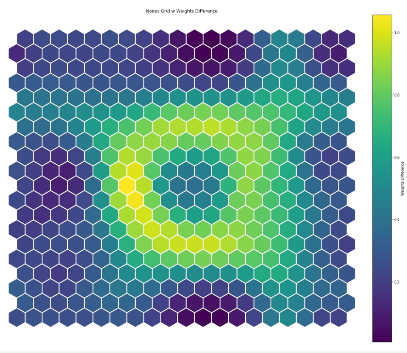
Fig. 2: Anomaly detection in a typical telecom KPI - Once the anomaly is identified, we also need to ascertain what services would it impact or what could have been the source of the anomaly. This is particularly difficult for telecom data as hundreds of KPIs are involved making their tracking manually, intractable. Hence, we used self organizing maps to automatically find relationships between the KPIs that might suggest which ones can be a probable cause of failure or could be impacted by an anomaly.